
It’s said that Pythagoras once claimed that everything is fundamentally number. He found numerical relationships in things that seems a world away from mathematics. Two and a half thousand years later we’re happy with quantifying things, but it can still be hard. For example, Berntson back in 1994 looked at the problems of describing a root’s fractal dimensions. Roots can be messy so how can you analyse them rapidly – or better still how can you automate it? RootGraph: a graphic optimization tool for automated image analysis of plant roots by Cai et al puts forward a new technique.
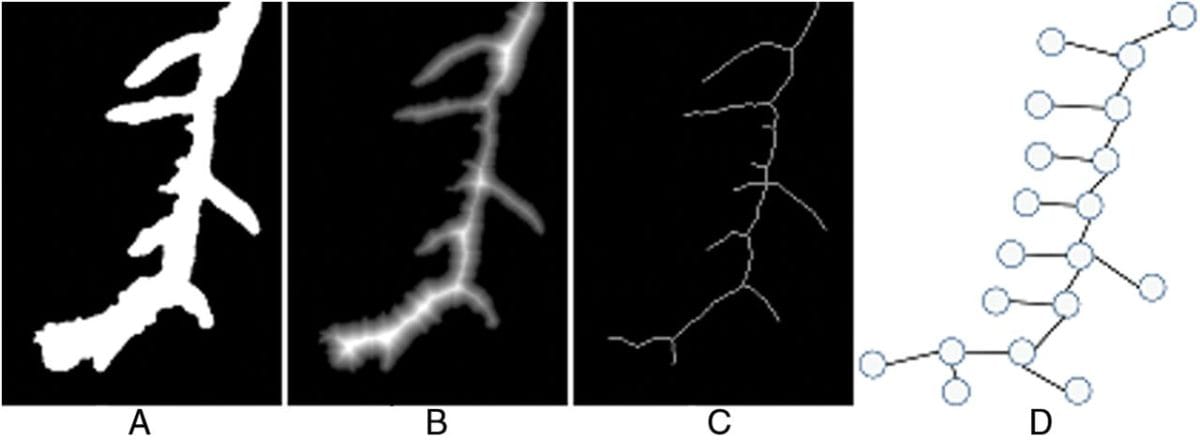
The analysis works in a series of steps to change an image of a root into a graph. Mapping the junctions where roots connect means that a computer can work out what is a primary root and what a lateral root, by examining its connectivity. It’s an approach that reminds me a lot of space syntax from geography. Once the computer knows what type of root it’s dealing with, it can spot freak results and work out what to do. For example, roots overlapping each other when they’re scanned could look like a single, oddly connected root in the scanner.
It’s the ability to eliminate noise that’s the key element of the paper, as it means that the system can operate with speed.
Reducing a root system to a graph might look like a step away from reality, but it also allows for a lot of information to be included in the analysis. The difference between primary and lateral root might not be simple, as lateral roots can branch. However because the roots are graphed, any root or root segment can be analysis by where it sits in the network. Where differences occur in root growth, the network analysis should show exactly what sort of roots are changing. Also the fact that it’s image based leaves open the possibility of changing where the data comes from. 3D analysis should be possible with the same system, allowing analysis of root systems in situ.
The paper appears in this month’s issue of the Journal of Experimental Botany, so you should have no troubles checking it out yourself.
Jinhai Cai, Zhanghui Zeng, Jason N. Connor, Chun Yuan Huang, Vanessa Melino, Pankaj Kumar, Stanley J. Miklavcic, 2015, ‘RootGraph: a graphic optimization tool for automated image analysis of plant roots’, Journal of Experimental Botany, vol. 66, no. 21, pp. 6551-6562 http://dx.doi.org/10.1093/jxb/erv359